

The transition from a fuel-based economy to one that is neutral in greenhouse emissions is the great global challenge of this century, and represents a path of no return if we wish for our species –and the majority of living beings– to continue to exist in favourable living conditions. This energy transition will influence the entire value chain of the economy and therefore our relationship with the biosphere. The profound change in this relationship will mean the modification of human behaviour, both materially and subjectively, on a day-to-day basis.
El contexto de las fósiles no es favorable. La crisis energética actual se debe a la llegada de las tasas máximas de extracción del recurso, reduciendo la calidad y aumentando los costes de extracción y refino. El indicador general en la extracción es la curva del pico del recurso, y en la eficiencia global del recurso es la energía neta calculada entre el punto del consumo y origen, incluyendo todos los costes energéticos invertidos durante todas las etapas intermedias, también denominada tasa de retorno energética.
Out of the many problems that emerge –and will emerge– during this energy transition, those derived from technological change are especially critical, since they imply different forms of generation to satisfy the energy demanded by the economy. Example of this will be the gradual substitution of oil for renewable energies. This substitution will imply, at least, 1) ending of oil extraction; 2) promoting other types of machinery, materials and costs that allow the development of renewable technologies; 3) providing education for new jobs in the renewables sector; and 4) adjusting the legislation in the electric system to accommodate new agents (e.g., energy communities, storage, electric vehicles).
If we dig a little deeper, solar photovoltaic and eolic technologies are the ones that have the best projection in the world market in terms of costs and scalability. Technologies that – alongside others like mini-hydraulics or those related to tidal and wave use – possess a production nature that is very different from their fossil contemporaries.
The behaviour of these five renewables is intermittent, that is, although their generation may be more or less predictable by meteorological models, we cannot increase it whenever it suits us. Therefore we face a problem of availability of different resources. While the availability of natural gas is restricted by its extraction and transport, which are –more or less– manageable, the maximum production of electricity in solar farms depends on the level of irradiation present at all times. The current exploitation of intermittent renewable energies has not been designed to be manageable.
It is not a trivial problem if we want to make the change –mostly– from fossil sources that are easy to plan, for other renewables whose management is more complex. Taking into account that electricity supply and demand must match instantly, and recognising a current energy system whose electrical, heating and transport are practically independent of each other, to decarbonise the economy to reach the Paris agreement, or to achieve a 100% renewable energy system –both scenarios especially based on this type of intermittent renewables for the majority of the regions– becomes a challenge that remind us of the impossible missions of the famous action movies.
Our research group, GEEDS, has studied the impact that the massive integration of intermittent renewable generation would cause using the MEDEAS system dynamic model [1] in monetary terms [3], and the availability of resources and land with the GCAM model [2].
The first estimation of intermittency impact in MEDEAS was made with a function whose only input is the percentage of intermittent renewable generation present in the electric mix. This effect consists in endogenously reducing the capacity factor –energy generated throughout the year with respect to the maximum that could have been generated, given an installed capacity– as the renewable percentage increases in the electric mix during the simulation. In this way, the existence of cuts due to overproduction at certain times of the day throughout the year (also called curtailment) is assumed. The implemented equations were duly justified according to historical cases and articles on the subject. However, the results show a rigid or conservative modelling, by not including options for the management of renewable intermittency, such as energy storage or coupling between energy sectors (Power-to-Heat technologies, such as heat pumps or electric boilers, for example). Nevertheless, and with this technological conservatism, it has been possible to find a scenario that achieves renewable plenitude in the electric system (not so in the energy system that includes more final energies, namely, heat, liquids, solids and gases) [5].
The encouragement and effort of GEEDS to detail this effect has led us to build a schedule model. This model is explained in the article that we are disseminating through this post and you can find in the link included at the text.
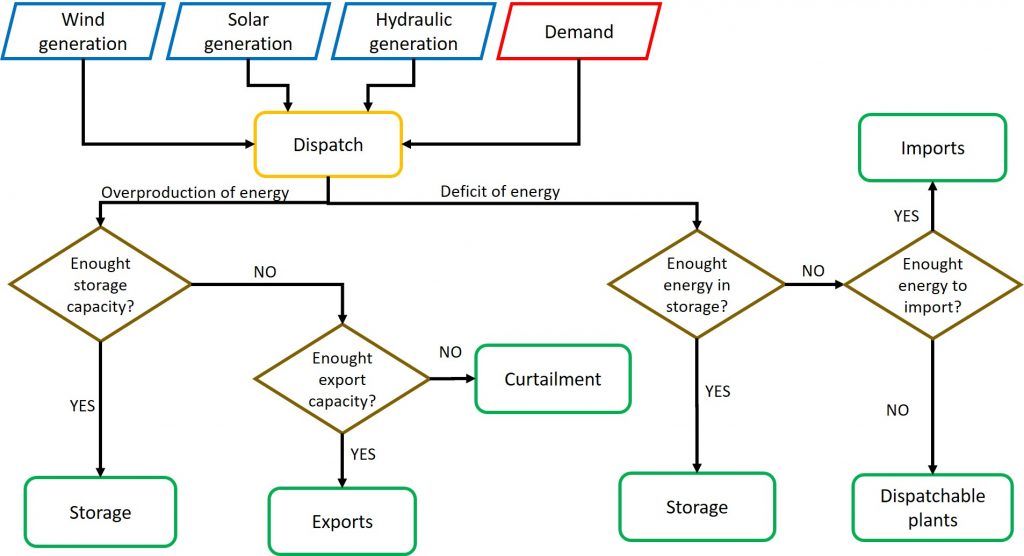
Regarding the method, given the huge variability of the renewable sources and electricity demand, we have condensed the historical hourly information extracted from the database maintained by Red Eléctrica –ESIOS– in various probability distributions. There are two objectives of these distributions, on the one hand they allow us to observe the type of probabilistic profile found in each type of hour studied, and on the other to generate the generation and demand values in each hour of the simulation. The historical period of the hourly data covers the period from January 1, 2014 to December 31, 2019. The representative hourly types are based on the season of the year, hour of the day, and if it is a business day or holiday non-working day (the latter only in the case of the demand). The renewables that we analyse in the article are solar (photovoltaic and concentrated), wind power (onshore) and dam hydraulics. Given an hour, the code manages the overproduction of the electricity deficit. The flexibility options –technologies capable of managing overproductions and electricity deficits to integrate more renewable production– included in this study are storage, international connections (imports and exports), as well as manageable or backup generation plants (fossil and renewable, such a biomass or geothermal).
These flexibility options are restricted. In the case of storage at maximum power and availability of loading or unloading. In the case of connections abroad, their availability is restricted to a maximum import and export power. Figure 1 represents this flow of decisions.
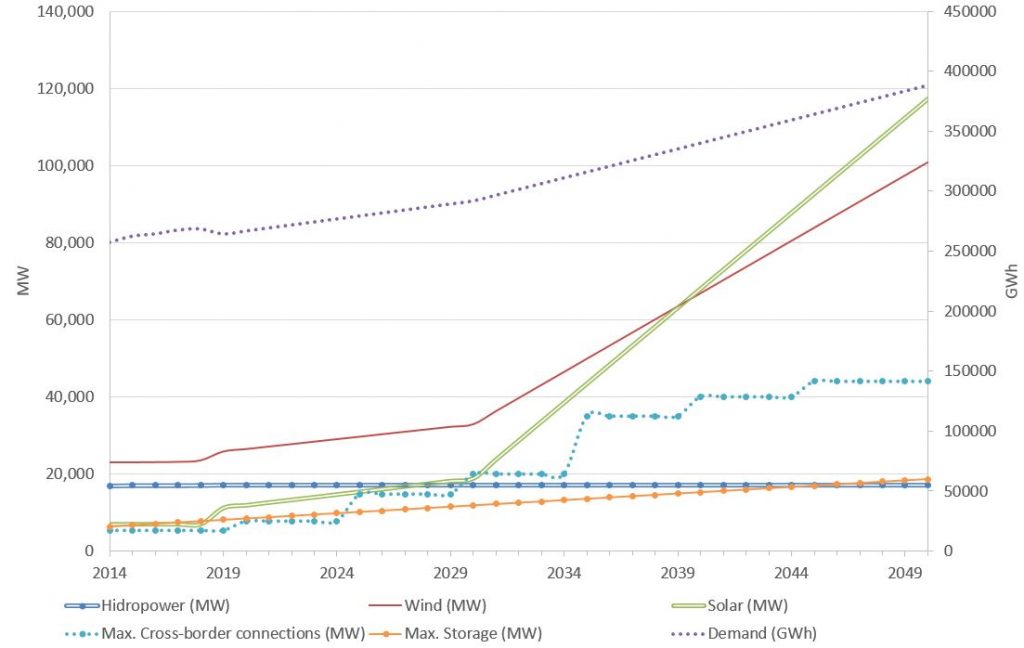
The future projection of the studied scenario is shown in Figure 2. As can be seen, we have included strong growth for renewables, the object of study. The rest of variables experience a more moderate growth, increasing over time both the electricity demand (units on the secondary vertical axis), as well as the storage capacity and connection with other regions. All projections are based on reports and published studies.
Results of interest can be found in the article, both with regard to seasonal behaviour and hourly detail, as well as for the historical period and for the projected period.
Given the peninsular conditions, the most complex periods in management for the system will be the central hours of the summer days, due to the magnificent solar contribution, especially in those clear and windy times, when demand begins to fall due to the reduction in electricity consumption (14:00-16:00), result of the nature of our current working hours. From this it follows that a possible measure in the management of demand is the reduction of daily working hours, allowing 6-hour shifts in a row to flatten the demand peaks and improve productivity while reducing unemployment.
The behaviour (average and standard deviation) of renewable generations in the peninsular territory of the Spain can be analysed in Figure 3. From it we can extract general information from these sources. The seasons with the greatest contribution are summer –solar–, winter –hydraulic and wind–, the wind source turns out to be the most intermittent and the period of greatest and least renewable contribution per season and day are located in winter at midday and at night in summer, respectively. From the observation in the pattern of hydraulic energy, we can suggest that its management is influenced by rainy seasons, and by maintaining a very similar pattern, taking advantage of the times of greatest benefit in the peninsular electricity market to plan its modes of pumping and turbination.
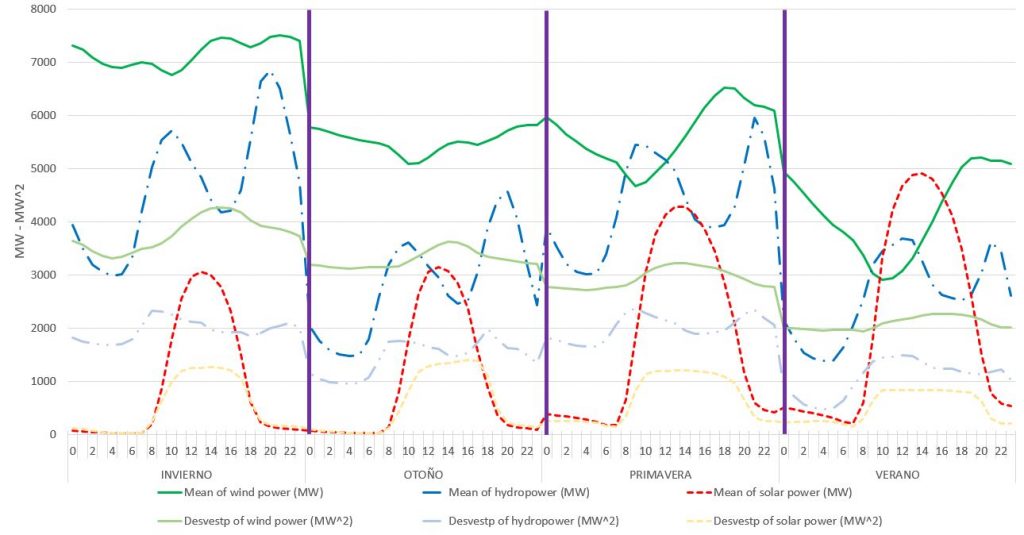
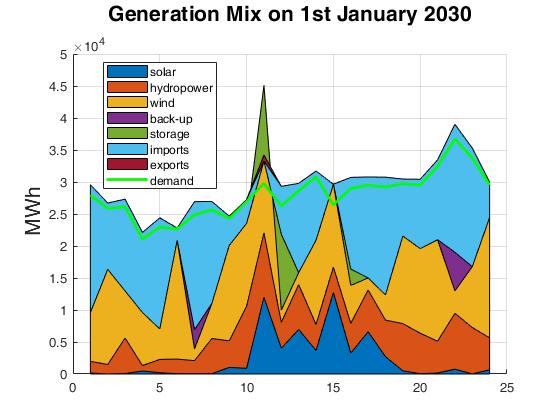
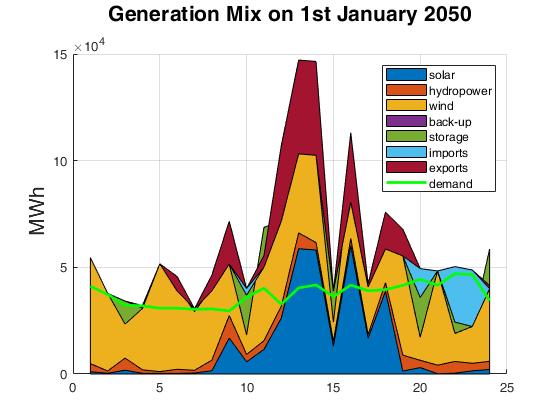
Figure 4 clearly shows the high solar contribution during the central hours of the day, as well as the need to make the supply side more flexible to conveniently satisfy demand. Power ramps between consecutive hours are also available, increasing dramatically as we approach the 2050 of the simulation.
The role of international connections changes from being a net importer to a net exporter as we progress through the simulation. We consider future work to further restrict this flexibility option, since the results show an exaggerated use (more than 140 TWh) as they are not restricted in the model by international agreements, for example. In the current modelling, as long as there is available capacity, it is exported or imported without considering the requests of the neighbouring regions, thus, the contradiction could be incurred that in Portugal there was energy surplus and Spain exported energy to this country through its border to the West, establishing a hierarchy that has little value –if not negative– in geopolitics.
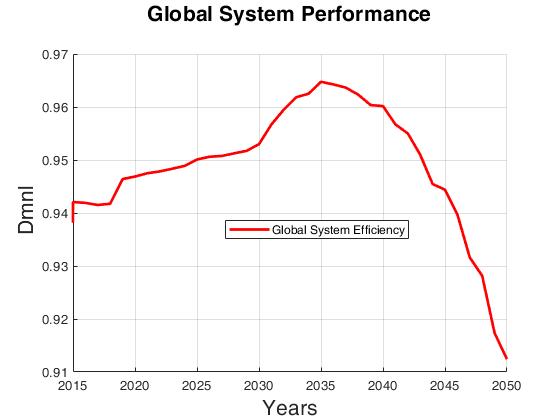
The evidence of the need for greater flexibility in the system is a general result of the research, the need to withstand high intermittent loads and take advantage of the renewable energy available. Figure 5 shows the efficiency of the electrical system in terms of losses. The most suitable year will be around 2035, after which this output variable falls rapidly due to the increase in losses in the network and the curtailment. Significantly relevant result, as it implies the existence of more optimal management under certain configurations.
For the research group, this work represents a turning point in the studies of the electrical system in IAMs, evidencing the need to include the hourly consequences in the annual models with which the group has been working (MEDEAS, MODESLOW, LOCOMOTION projects).
Everything modelled up to this point, as well as the rest of the points mentioned in the third paragraph (future work), must be captured in the energy models to test policies as comprehensive as possible.
This study has recently been published in the journal DYNA under the title “Analysis of the variable renewable energy in the Spanish power system based on kernel probabilistic distributions” DOI: http://doi.org/10.6036/9892.
This is the first article of the doctoral thesis of Gonzalo Parrado Hernando, author of this blog post, the first of a series of studies aimed at representing these consequences in IAMs as he embarks on the subject, seeking to make the system more flexible to coherently integrate renewable energies with the group’s sustainability studies, adding useful information in the political decisions of energy transition.
References:
[1] Iñigo Capellán-Pérez, Ignacio de Blas, Jaime Nieto, Carlos de Castro, Luis Javier Miguel, Óscar Carpintero, Margarita Mediavilla, Luis Fernando Lobejón, Noelia Ferreras-Alonso, Paula Rodrigo,Fernando Frechoso and David Álvarez-Antelo, ‘MEDEAS: a new modelling framework integrating global biophysical and socioeconomic constraints.‘ Energy & Environmental Science, issue 3 (2020): https://doi.org/10.1039/C9EE02627D
[2] Dirk-Jan van de Ven, Iñigo Capellan-Peréz, Iñaki Arto, Ignacio Cazcarro, Carlos de Castro, Pralit Patel & Mikel Gonzalez-Eguino, ‘The potential land requirements and related land use change emissions of solar energy’. Scientific Reports 11, 290 (2021): https://doi.org/10.1038/s41598-021-82042-5
[3] Jaime Nieto, Óscar Carpintero, Luis Fernando Lobejón, Luis Javier Miguel, ‘An ecological macroeconomics model: The energy transition in the EU’. Energy Policy, volume 145, 111726 (2020): https://doi.org/10.1016/j.enpol.2020.111726
[4] Gonzalo Parrado-Hernando, Fernando A. Frechoso Escudero, Luis Javier Miguel González, ‘Analysis of the variable renewable energy in the Spanish power system based on Kernel probabilistic distributions’. DYNA journal, March 2021, volume 96, pages 179-185. DOI: https://doi.org/10.6036/9892
[5] Iñigo Capellán-Pérez, Carlos de Castro, Luis Javier Miguel González, ‘Dynamic Energy Return on Energy Investment (EROI) and material requirements in scenarios of global transition to renewable energies’. Energy Strategy Reviews 26 (2019) 100399. DOI: https://doi.org/10.1016/j.esr.2019.100399